Cannabis · Data Platform
Glass
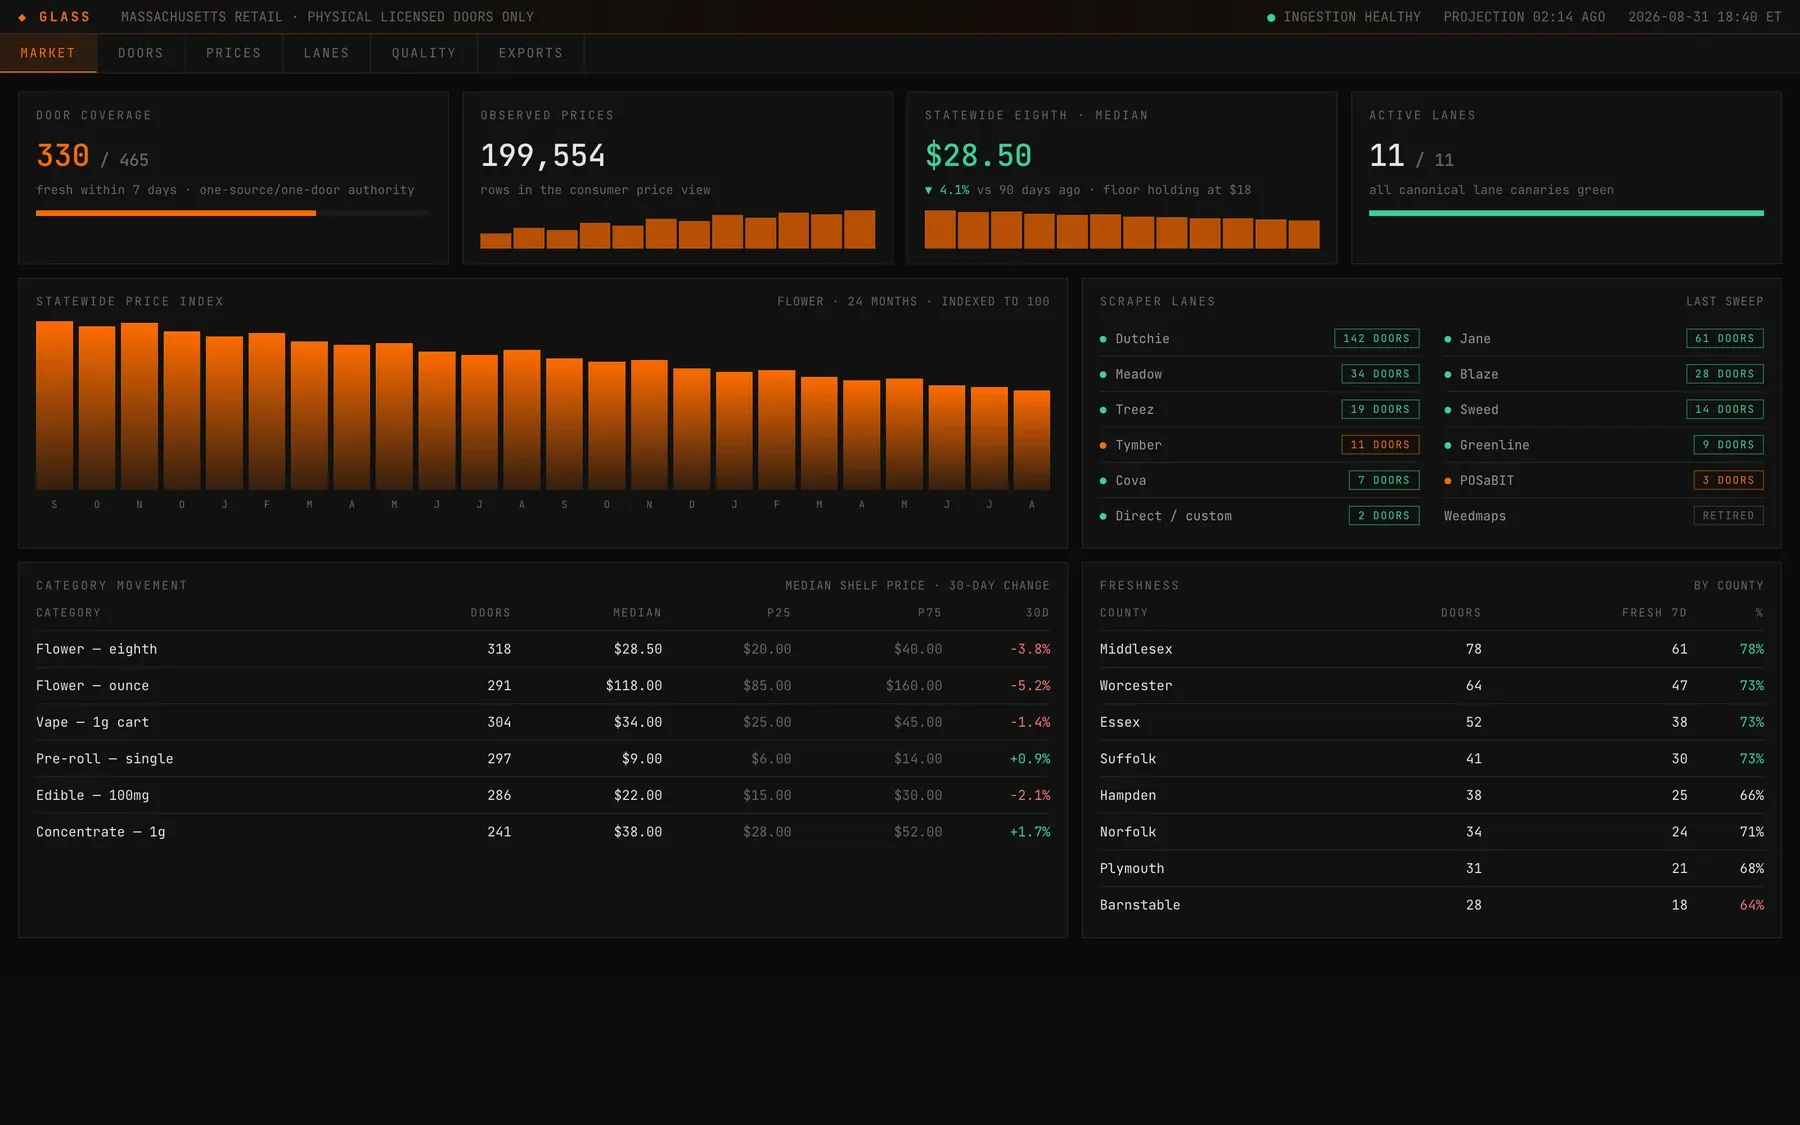
A market-intelligence terminal for Massachusetts cannabis retail — one clean price view assembled from a dozen incompatible menu vendors.
The problem
Shelf pricing in a state market is scattered across whichever menu platform each store happens to use. Everyone quotes numbers; nobody has the underlying rows. Without a single normalized view you cannot tell whether an eighth is priced above the market, whether a category is sliding, or whether a competitor just moved.
What we shipped
- Eleven scraper lanes covering the menu platforms that actually serve the state — Dutchie, Jane, Meadow, Blaze, Treez, Sweed, Tymber, Greenline, Cova, POSaBIT and direct storefronts
- Coverage of 330 of 465 licensed physical retail doors, refreshed on a rolling sweep with a freshness clock per door
- Roughly 200,000 observed price rows normalized into one product and category grammar
- Statewide price index plus category movement — median, P25/P75 and 30-day change by format
- Per-lane health canaries so a silently broken scraper cannot poison the index
- Export lane that feeds the sales desk, so reps see market context next to their own accounts

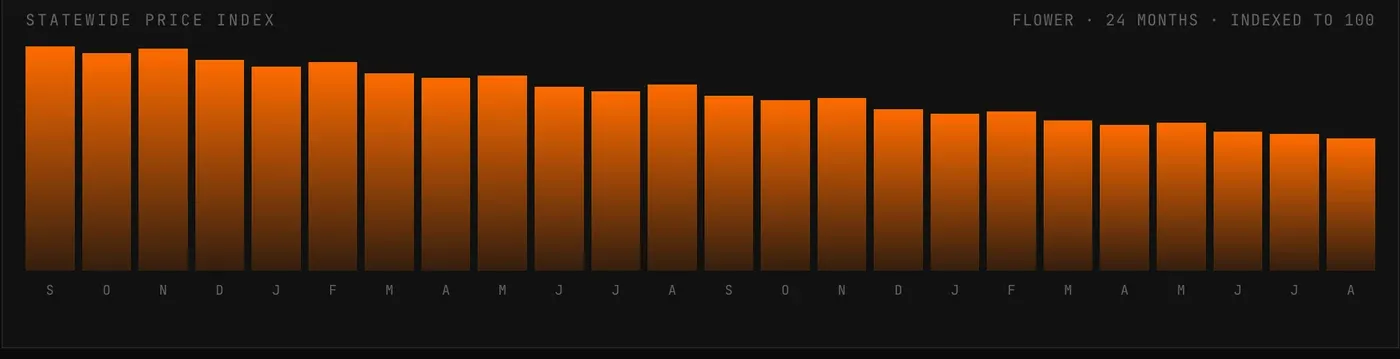
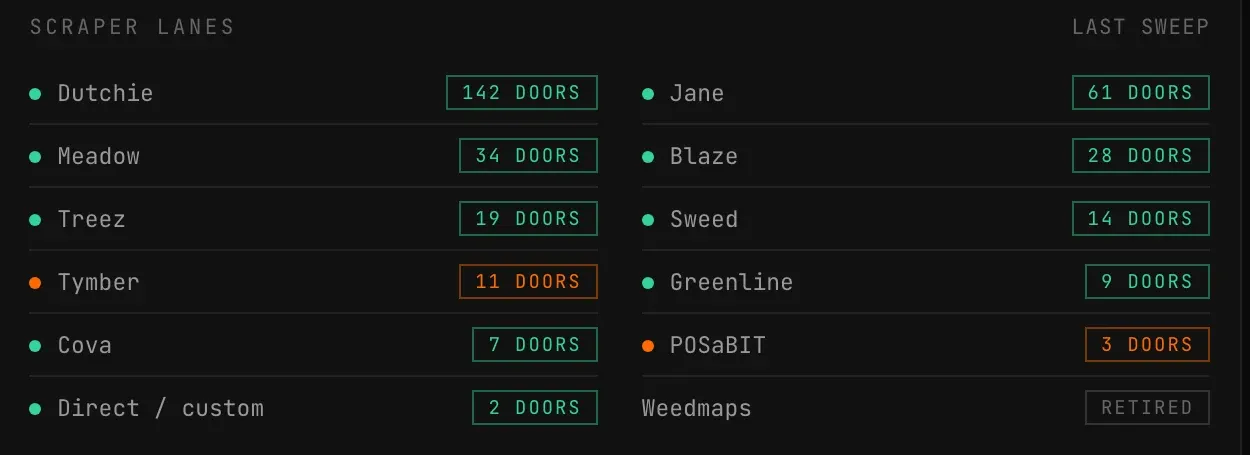
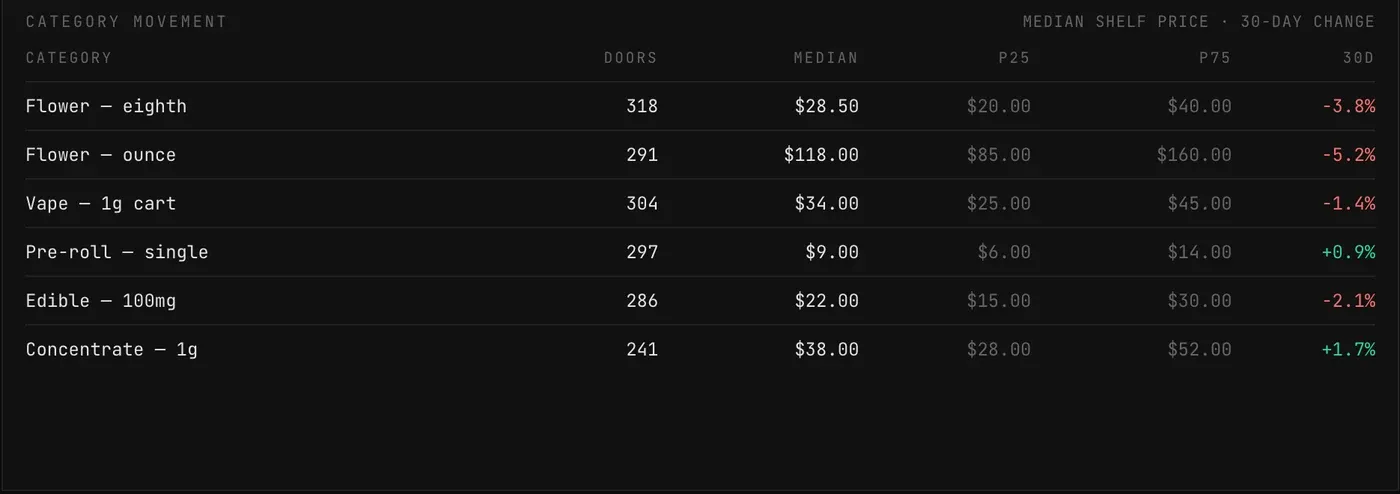
Coverage counts and lane list are real. Prices and county figures in these screens are illustrative.

Next step
Building something similar?
Tell us what you’re working on. You get a reply within one business day and a fixed price before any work starts.